Restaurant SEO case study · Koramangala, Bengaluru
How a Koramangala restaurant went from ₹1.8 lakh to ₹2.7 lakh a day with restaurant SEO, without a single discount
By Pixelizt · 20 October 2026 · 5 min read · Client name withheld at their request
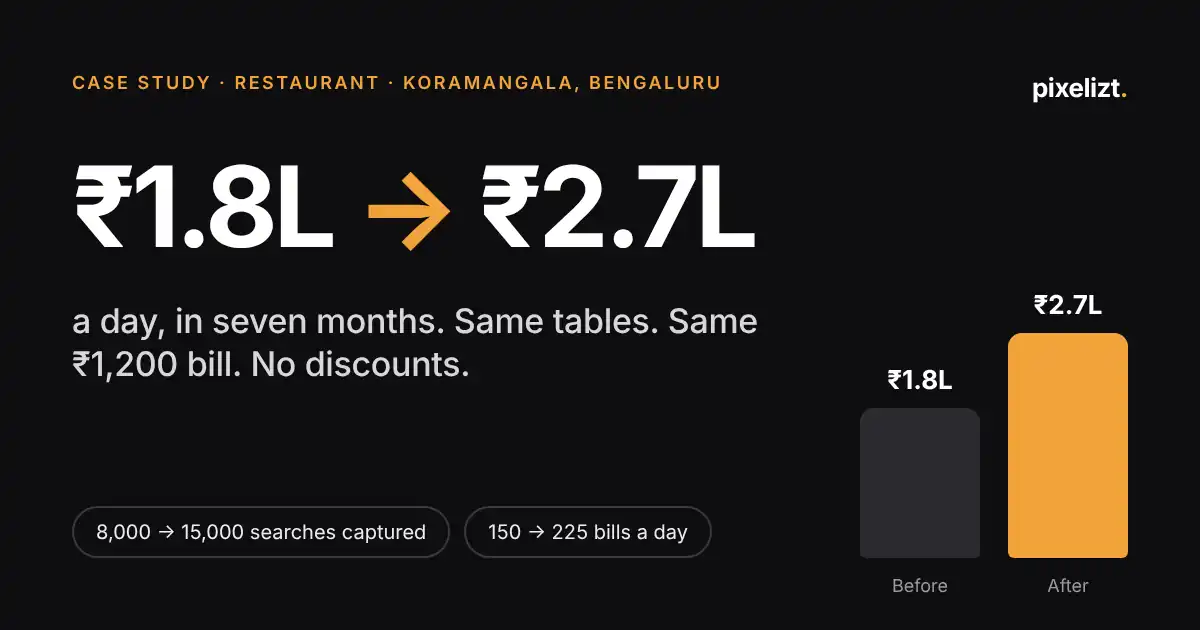
A well-known restaurant with 40 to 45 tables and a ₹1,200 average bill. Seven months of restaurant SEO took daily sales up 50 percent with the same tables, the same bill and no offers. Nothing new was created. About 20,000 people a month were already searching for a place like this, and the restaurant was visible to 8,000 of them. Restaurant SEO made it visible to 15,000.
Before restaurant SEO
Daily sales
₹1.8 lakh
A day, at a ₹1,200 average bill
Monthly sales
₹50 to 55 lakh
Estimated, as reported by the owner
Searches captured
About 8,000
Of about 20,000 relevant searches a month
Bills a day
About 150
40 to 45 tables, no discounts
After 7 months of restaurant SEO
Daily sales
₹2.7 lakh
Up about 50 percent, same ₹1,200 average bill
Monthly sales
₹80 to 85 lakh
Estimated, as reported by the owner
Searches captured
About 15,000
87.5 percent more of the same 20,000 searches
Bills a day
About 225
Same 40 to 45 tables, still no discounts
01 · Before restaurant SEO
A successful restaurant with no SEO system bringing in new customers
The restaurant was already doing well and had a reputation to protect. The owner did not want to run offers or discounts, so any growth had to come from more covers at the same bill. Whatever came in came from reputation and footfall. There was no restaurant SEO, no structured system consistently bringing in new customers from search.
Daily sales
₹1.8 lakh
Average bill
₹1,200
Bills per day
About 150
Tables
40 to 45
Estimated monthly sales
₹50 to 55 lakh
Discounts and offers
None
02 · The demand gap
20,000 people were searching. 8,000 found the restaurant.
Restaurant SEO starts with demand, not keywords. We mapped every way people search for a restaurant in Koramangala: cuisine, location, dishes, "near me", best restaurants, occasions, family dining, amenities, questions, AI searches. People search in a hundred different ways, and the mapping covered all of them. The total came to a range of 19,500 to 22,000 relevant searches a month, rounded to 20,000. None of them random. Every one is someone looking for what this restaurant serves.
Total market demand
About 20,000 a month
Relevant searches for a restaurant like this one, in this area
Captured before
About 8,000
The searches where the restaurant was actually seen. About 150 bills a day.
Not captured
About 12,000
People who wanted this kind of restaurant and found a competitor instead
The brief wrote itself. To grow sales by 50 to 100 percent, capture more of the demand that already existed. The opportunity was never to create demand.
03 · Our restaurant SEO process
We found the customers the competitors were getting, then built the system to capture them
Five steps, in this order. The first three are research. The fourth is the restaurant SEO build. The fifth never stops.
01
Map customer demand
Every way a person could search for a restaurant like this one. Over 100 search patterns, sized to roughly 20,000 searches a month.
02
Find who was capturing it
Which restaurants kept appearing for those searches, and what they had done: Google Business Profile, Maps, websites, menus, reviews, content, social, aggregators. Written up as one research document.
03
Find the market gap
Exactly where the restaurant was losing visibility and why the competitors were being found instead. From that, targets for 3, 6 and 12 months.
04
Build the customer-capture system
The whole journey connected end to end: search, Google and Maps, the restaurant listing, the website, the menu, the proof, then a call, a booking or directions.
05
Keep capturing more demand
New search patterns, competitor moves and new gaps are checked continuously, and the system is improved each time.
The goal
Not simply to rank
The goal was to turn customer searches into restaurant visits, so the system is built around the full journey, not the first click.
The customer-capture journey
Search → Google / Maps → Restaurant found → Website → Menu → Trust (reviews and photos) → Call, booking or directions → Visit
Stages we track: Search · Discovery · Restaurant · Menu + Trust · Action · Visit · Revenue
04 · After seven months of restaurant SEO
15,000 of 20,000 searches captured, daily sales up 50 percent
Captured demand went from about 8,000 to about 15,000 searches a month, 87.5 percent more from the same market, with no spend on ads or discounts. Measured at the till, that is 225 bills a day instead of 150, with the same tables and the same average bill. This is what restaurant SEO looks like when it is measured in covers rather than rankings.
Metric
Before
After
Estimated monthly sales
₹50 to 55 lakh
₹80 to 85 lakh
Daily sales
₹1.8 lakh
₹2.7 lakh
Average bill
₹1,200
₹1,200
Bills every day
About 150
About 225
Searches captured a month
About 8,000
About 15,000
Tables
40 to 45
40 to 45
Discounts and offers
None
None
The 20,000 figure is the stated market-demand baseline for this case study. Captured-demand figures are the visibility measure used in the study, not confirmed bookings. Sales figures are as reported by the owner.
The important part
Same restaurant. Same tables. Same average bill. No dependence on discounts.
The difference was a restaurant SEO system built to capture more of the customer demand that already existed. It is not demand we create. It is demand that is already there, and the only question is how much of it you are capturing. A restaurant that moves from capturing 4,000 searches to 8,000 has a solid business and stops worrying about payroll. Fix the basics first. That is what we specialise in.
How much demand is your restaurant missing?
Send your restaurant name and location. We map the searches in your area, show you how many you are capturing today, and send a free 10-point restaurant SEO audit of your Google listing, website and reviews within 2 working days.